Proactive visibility for better care and stronger agency performance
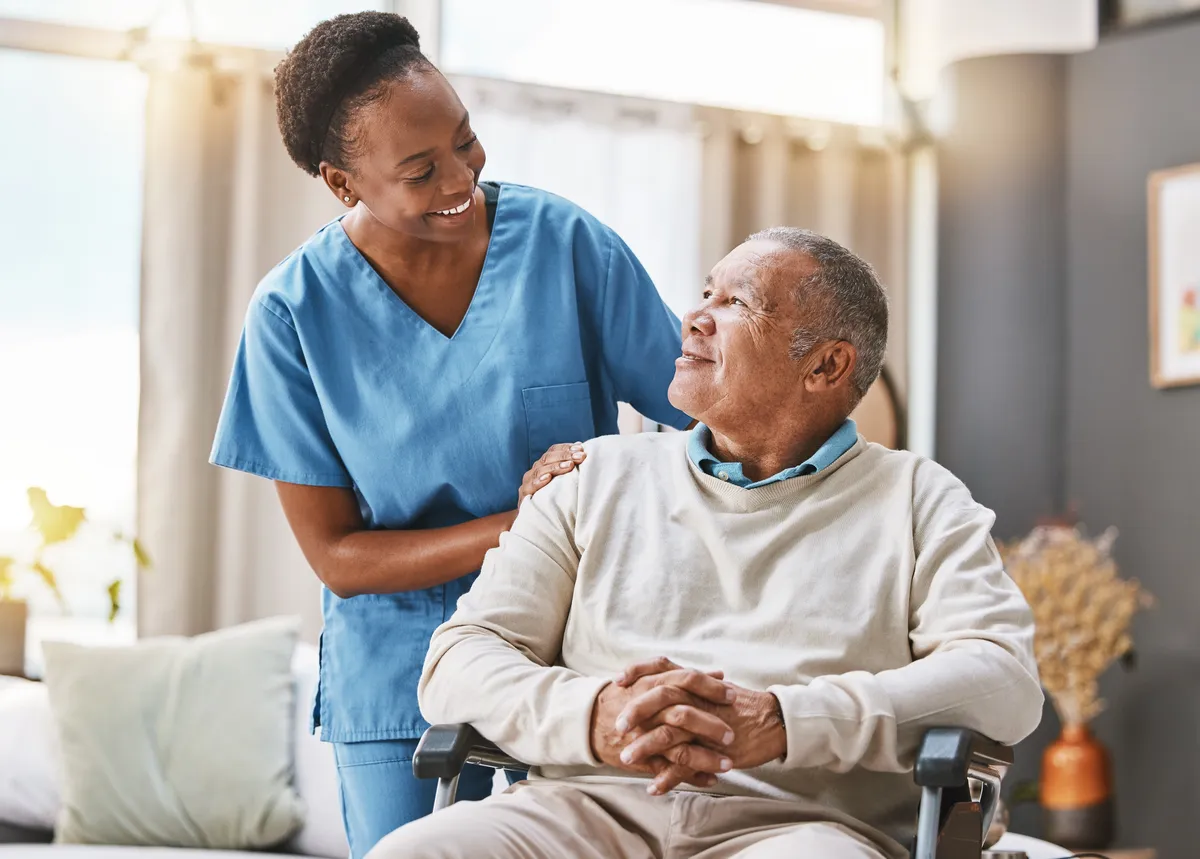
Families naturally want reassurance between visits. Caregiver by Cognitive helps you stay connected to what matters day to day, offering a clear view of routines and changes without cameras or wearables.

.avif)
A simple, human view of the day
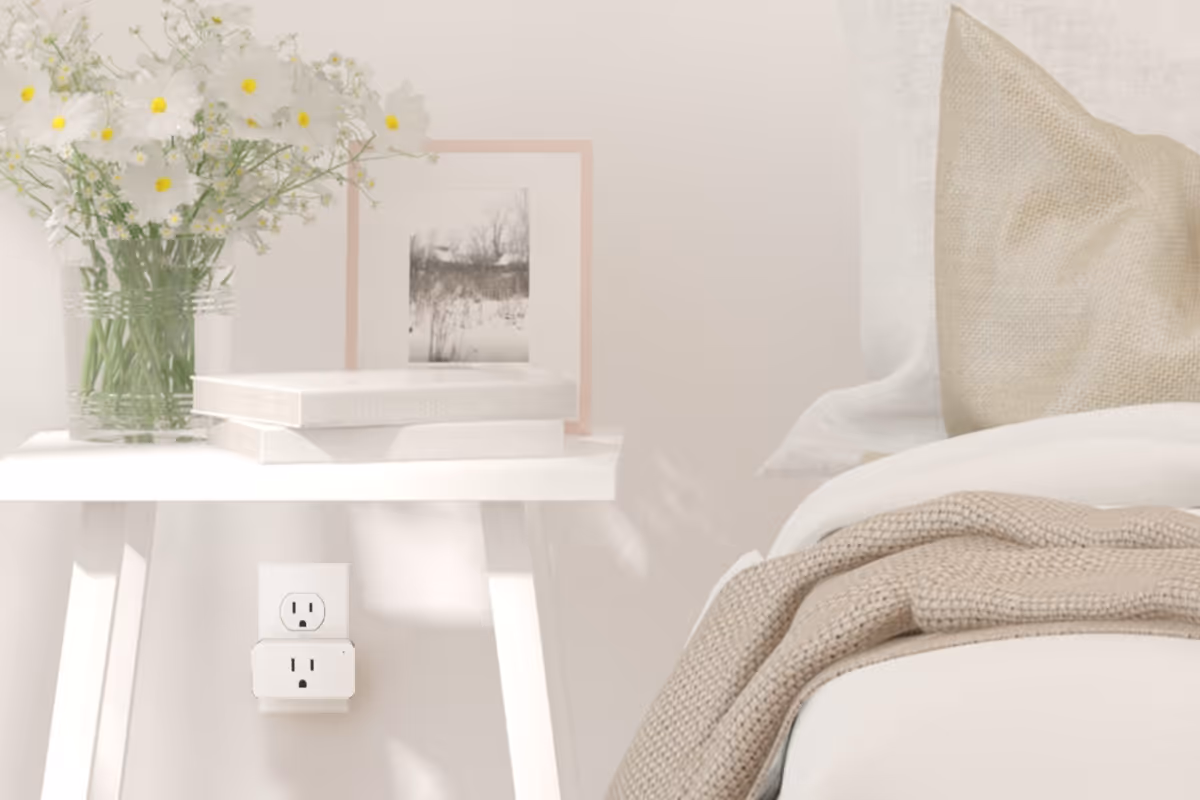
Invisible Technology
Quietly supporting care behind the scenes
Rise and Shine
07:00Denise is awake after around 6 hours of sleep.
Bathroom
09:00Bathroom visits are within a normal range.
Inactivity
11:00No movement has been detected for a couple of hours.
Lunchtime
13:00Kitchen activity has increased slightly.
Living Room
14:00General activity has increased.

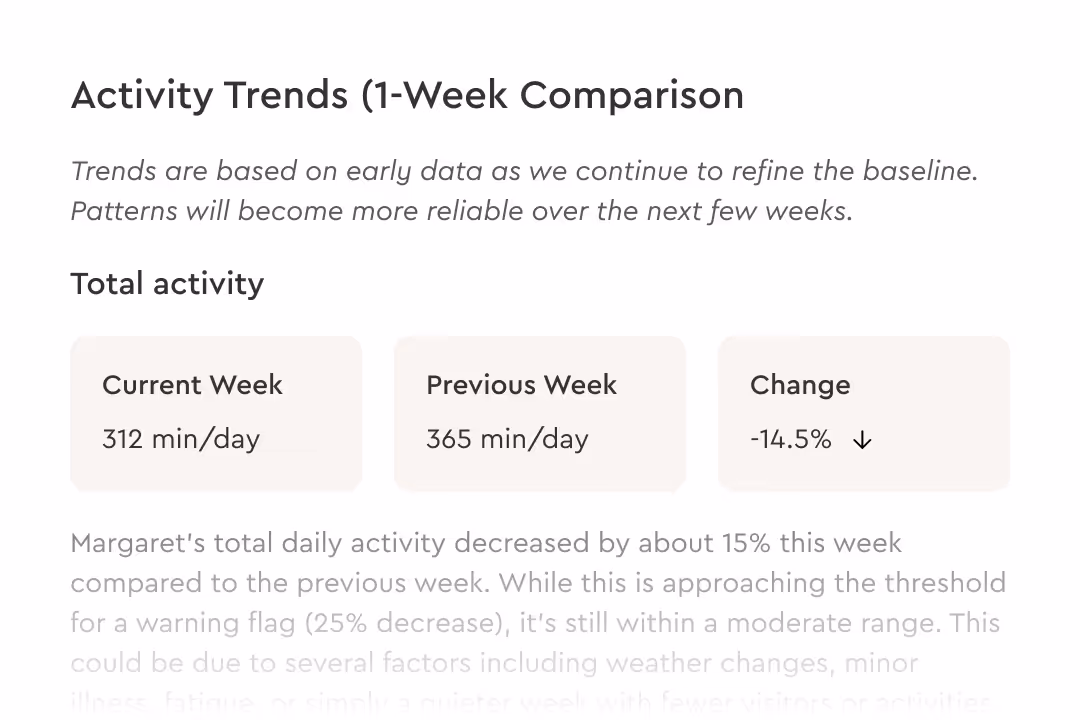
Insight between visits
Stay informed about daily routines and subtle changes, so your team can respond with clarity and confidence without being intrusive.
Privacy-first technology
Designed to respect dignity at every step. No cameras. No microphones. No wearables.


How Caregiver supports growing care operators
Families want to feel confident their loved ones are safe, even when no one is there. When you can offer that reassurance, trust grows and so does your service.
Increased revenue
With a clearer understanding of daily patterns, you can confidently recommend additional support where it’s genuinely needed.
Offer services families recognize, value, and are willing to pay for.
Reduced costs and risk
Identify changes earlier and avoid unnecessary escalations or emergency interventions.
Maintain clear records that support better care decisions.
Operational efficiency
Care teams arrive prepared with context.
Fewer check-in calls. Better coordination between staff and families.
Stand out for the right reasons
Offer a thoughtful, privacy-first approach that builds trust.
Win higher-value clients and retain them longer.
How it works
Caregiver uses CarePods to understand movement patterns throughout the home.
No cameras. No microphones. No wearables. Nothing for clients to manage.
Simple setup
Establish patterns
Notice meaningful changes
Clear visibility
What the system does
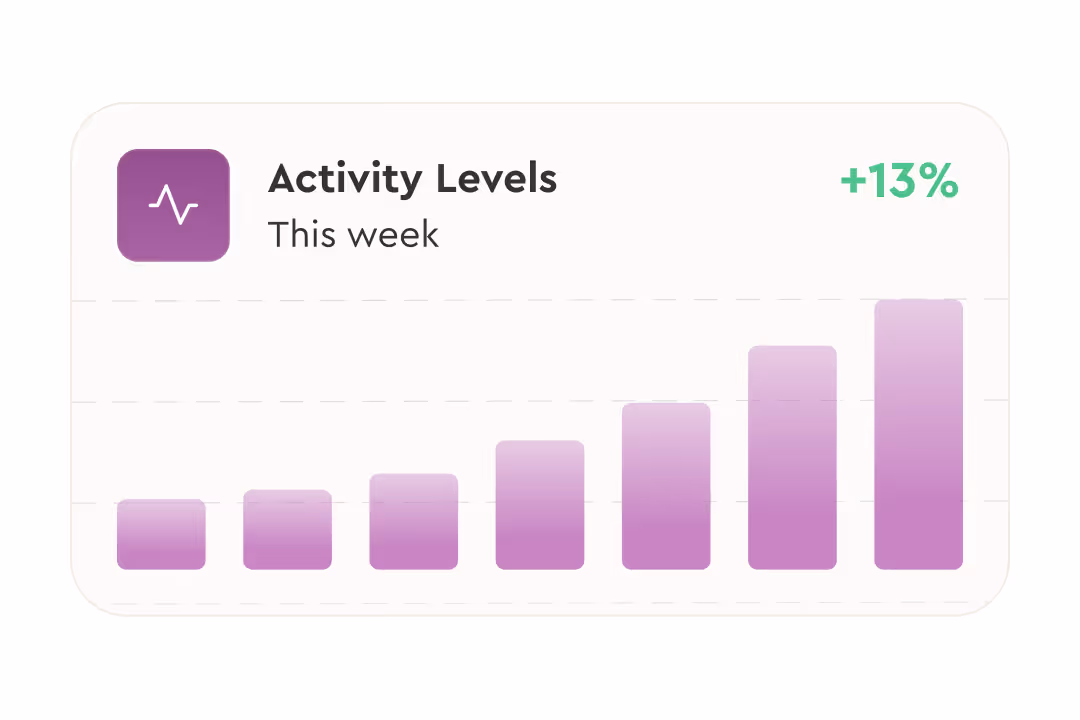
Real-time activity insights
Track patterns and changes without cameras or wearables.
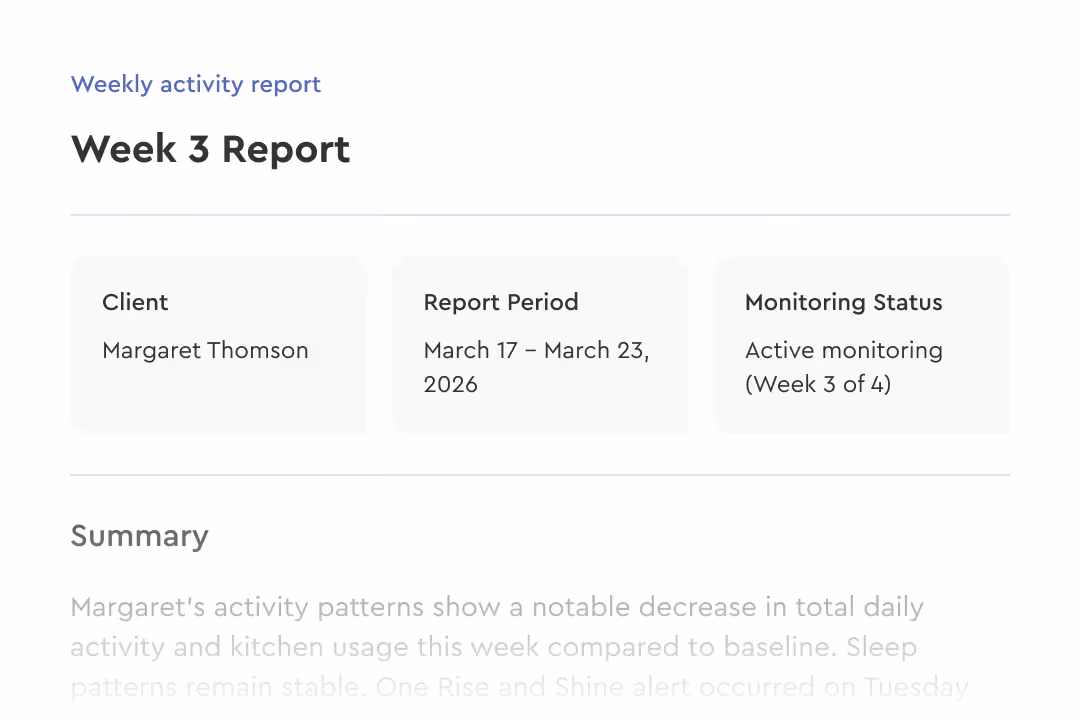
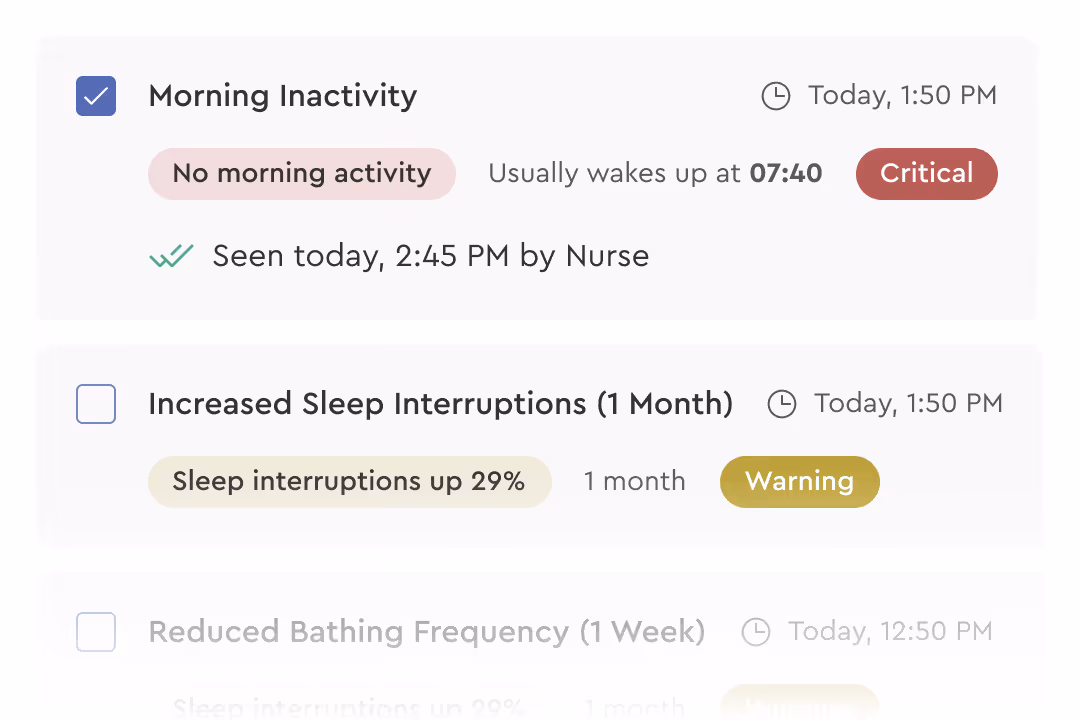
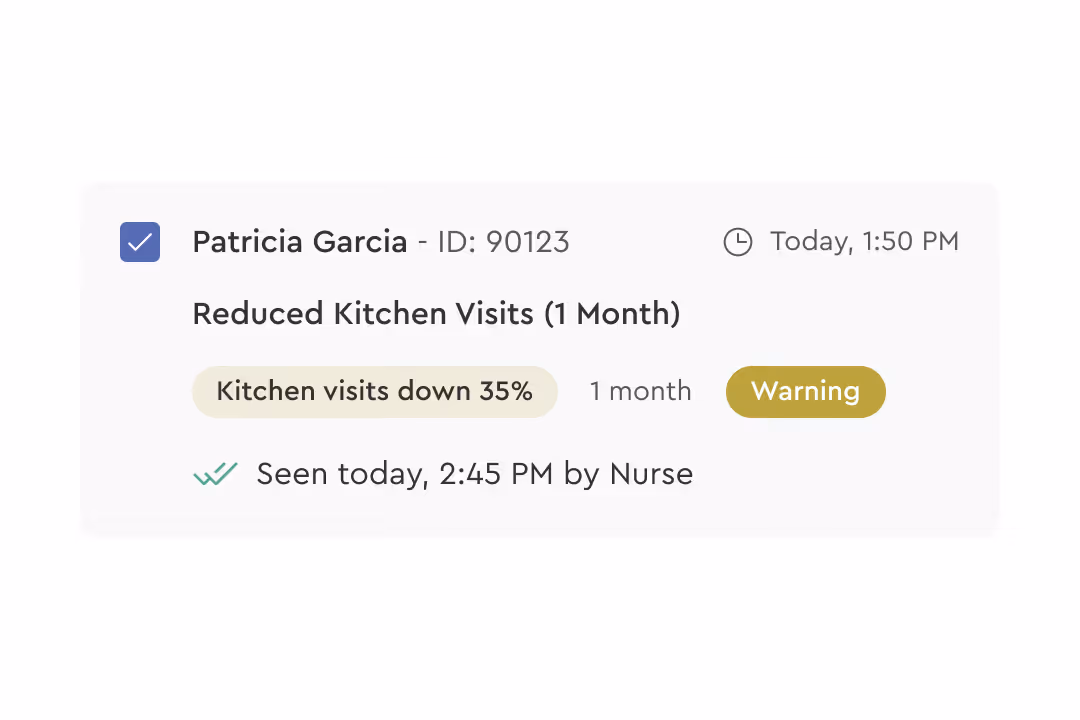
Structured reporting and alerts
Know what's happening between visits with clear, actionable data.

Agency dashboard coordination
Manage care plans and respond faster with better information.
Real impact in real homes
Care operators using Caregiver are seeing meaningful improvements in both care and operations.
Increased client revenue
Spot changes earlier and create data-backed reasons to adjust care plans
Increase in client retention
Families report stronger confidence and peace of mind
See what’s happening between visits
Understand daily life more clearly without intrusion.
Give your team the confidence to act earlier, and families the reassurance they’re looking for.
FAQs
Find answers about privacy, setup, and how Caregiver works in real homes.